

Project Maple
Cover
This document is a confidential information memorandum for Project Maple. The business being presented is Maple Crest Heating & Cooling.
Confidentiality statement
A confidentiality attestation for this project was completed on 2026-09-15.
Deal header
Maple Crest Heating & Cooling, Mississauga, ON. hello Business: Maple Crest Heating & Cooling Location: Mississauga, ON Latest period revenue: $7,400,000 Normalized earnings (EBITDA): $1,678,685 Final multiple: 3.52x Valuation low: $4,427,094 Valuation mid: $6,324,420 Valuation high: $8,221,746
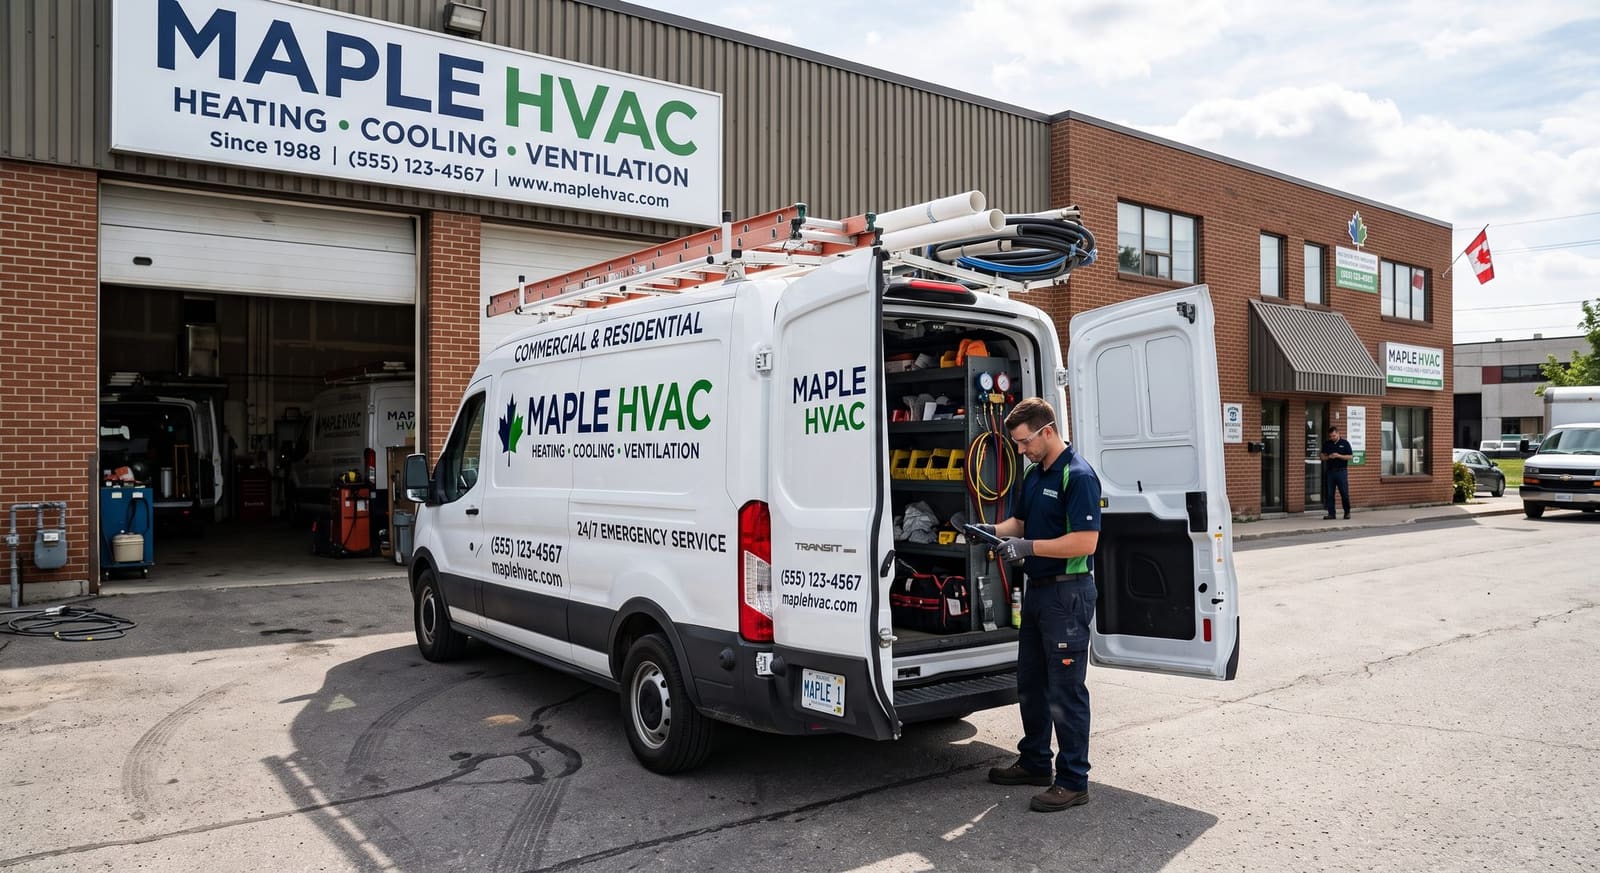
Executive summary
Maple Crest Heating & Cooling operates in the heating and cooling, or HVAC, service type. The business model is transactional, serving a mixed customer base. The owner has been with the business for over 10 years and is seeking a planned transition over three to five years. The primary goal is growth, with a sale open on the right terms. The deal kind sought focuses on HVAC service and tune-ups. The business employs between 11 and 25 individuals. For the latest period, the business generated $7,400,000 in revenue. The valuation for the business is based on a final multiple of 3.52x.
Investment highlights
The business demonstrates strong financial performance, with revenue growth of 6.5% in the latest period over the prior period. It is also profitable at the operating line, showing an EBITDA margin of 21.8% for the latest period. An established revenue base is evident, with the latest period revenue reaching $7,400,000. Normalized earnings are $1,678,685, indicating that the earnings are already adjusted for a buyer. Customer loyalty is a key asset, as demonstrated by a repeat customer rate of 60%. The business has a solid track record, having been in operation for 14 years. Operational efficiency is supported by documented procedures. The business scores well on several value drivers that buyers typically consider, including Financial Performance, Owner Dependence, Single Points of Failure, Competitive Moat, Growth Potential, Cash-flow Strength, and Customer Satisfaction.
| Highlight | Evidence |
|---|---|
| Revenue is growing | Revenue growth, latest period over prior: 6.5% |
| Profitable at the operating line | EBITDA margin, latest period: 21.8% |
| An established revenue base | Latest period revenue: $7,400,000 |
| Earnings already normalized for a buyer | Normalized earnings: $1,678,685 |
| Customers come back | Repeat customer rate: 60% |
| A track record, not a start-up | Years in business: 14 |
| The business runs on written procedures | Documented procedures: Yes |
| Strength on the drivers buyers price | Value drivers scoring well: Financial Performance, Owner Dependence, Single Points of Failure, Competitive Moat, Growth Potential, Cash-flow Strength, Customer Satisfaction |
Business model
The business model is transactional, catering to a mixed customer type. This approach allows for flexibility in service delivery and customer engagement.
For valuation purposes, the business can be compared to multi-location heating and cooling (HVAC) companies with a mixed customer base in Ontario, operating in the mid-market segment.
Products and services
The company maintains a comprehensive price book with 11 distinct priced services on file. This allows for clear service offerings and transparent pricing for customers.
A representative service offered is furnace repair with standard parts, priced at $420. The median service price across all offerings is also $420, indicating a consistent pricing strategy.
| Service | Price | Unit | Category |
|---|---|---|---|
| Furnace tune-up and safety inspection | $189 | per visit | Maintenance |
| AC tune-up | $179 | per visit | Maintenance |
| Diagnostic service call | $129 | per visit | Repair |
| Furnace repair with standard parts | $420 | per job | Repair |
| AC repair with standard parts | $385 | per job | Repair |
| High-efficiency furnace replacement | $5,800 | per install | Installation |
| Central AC installation | $5,200 | per install | Installation |
| Cold-climate heat pump installation | $9,400 | per install | Installation |
| Tankless water heater installation | $3,900 | per install | Installation |
| Comfort Club maintenance membership | $25 | per month | Plans |
| Full duct cleaning | $499 | per service | Maintenance |
Revenue mix
The business generates a total monthly revenue of $152,303 from its priced services. A significant portion of this revenue, between 25% and 50%, comes from contractual or subscription arrangements.
The recurring revenue is primarily derived from auto-renewing contracts, providing a stable and predictable income stream. This is further supported by a strong repeat customer rate of 60.0%.
- Furnace tune-up and safety inspection6%
- AC tune-up5%
- Diagnostic service call5%
- Furnace repair with standard parts8%
- AC repair with standard parts6%
- High-efficiency furnace replacement23%
- Central AC installation17%
- Cold-climate heat pump installation19%
- Tankless water heater installation5%
- Comfort Club maintenance membership5%
- Full duct cleaning3%
| Service | Monthly revenue | Share |
|---|---|---|
| Furnace tune-up and safety inspection | $8,505 | 5.6% |
| AC tune-up | $6,802 | 4.5% |
| Diagnostic service call | $7,740 | 5.1% |
| Furnace repair with standard parts | $11,760 | 7.7% |
| AC repair with standard parts | $8,470 | 5.6% |
| High-efficiency furnace replacement | $34,800 | 22.8% |
| Central AC installation | $26,000 | 17.1% |
| Cold-climate heat pump installation | $28,200 | 18.5% |
| Tankless water heater installation | $7,800 | 5.1% |
| Comfort Club maintenance membership | $7,735 | 5.1% |
| Full duct cleaning | $4,491 | 2.9% |
Footprint
The business operates from a single location in Mississauga, Ontario, specifically at zip code L4X 1L9. This centralized operation allows for focused service delivery within its local market.
The location demonstrates strong market presence and accessibility, with a foot traffic proxy of 100 out of 100 and an accessibility score of 100 out of 100. These metrics suggest high visibility and ease of access for customers.
The coordinates for the business are 43.6256, -79.5663, pinpointing its exact geographical position within the region.
Headcount and labour
The company employs a total of 26 full-time equivalent staff members. This team supports the operational needs and service delivery of the business.
The business demonstrates strong efficiency in its labor utilization, generating $418 in revenue per labor hour. On average, there are 6.4 staff members on the floor at any given time, ensuring adequate coverage for customer needs.
Customer concentration
The company's Single Points of Failure pillar score is 75, which is notably higher than the industry median of 60. This suggests a robust operational structure with reduced vulnerability to individual customer or supplier dependencies.
Retention and pricing power
The business benefits from a strong repeat customer rate, with 60.0% of its clientele returning for additional services. This high retention rate underscores customer satisfaction and loyalty.
Service delivery is standard with options, allowing for some customization while maintaining operational efficiency. This approach balances customer needs with scalable service offerings.
The company demonstrates significant pricing power, as it is expected that under 10% of customers would leave in response to a 10% price increase. This is further supported by a Competitive Moat pillar score of 75, indicating a strong market position and reduced competitive pressure.
Acquisition economics
The business invests $14,000 in monthly marketing spend, which results in the acquisition of 60 new customers each month. This marketing effort is a key driver of growth.
The customer acquisition cost (CAC) is approximately $233 per new customer. This cost is recovered efficiently, with a payback period of 8.23 months.
The estimated customer lifetime value is $1,021, yielding a strong lifetime value to acquisition cost ratio of 4.37. This indicates that the value generated by each customer significantly outweighs the cost to acquire them.
Sales and marketing
The business currently allocates $14,000 to monthly marketing spend, which contributes to acquiring 60 new customers each month. This results in a customer acquisition cost of $233, with a payback period of 8.23 months.
The company also leverages a structured referral program and has identified 1 referral partner. For example, Mineola Plumbing is a referral partner, as plumbers often identify failing HVAC systems, and the business can reciprocate by referring plumbing issues encountered during HVAC installations. Another strategy involves deploying win-back email sequences for past customers to generate immediate service bookings.
| Play | Channel | Expected effect | Effort | Cost |
|---|---|---|---|---|
| Launch a targeted winter furnace tune-up direct mail campaign | Direct Mail | Predictable upfront cash flow and filled schedules during shoulder seasons in Mississauga | medium | medium |
| Rebuild your local digital marketing engine | Paid media and local SEO | Steady stream of emergency repair and replacement calls throughout Mississauga instead of relying solely on seasonal weather swings | high | high |
| Set up a structured double-sided referral program | Email and direct outreach | More high-margin furnace and AC repair jobs through trusted word-of-mouth without paying expensive ad rates | low | free |
| Deploy a win-back email sequence for past customers | Email Marketing | Immediate service bookings and quick revenue from homeowners who already know and trust your multi-location team in Mississauga | low | free |
| Partner | Category | Why they fit |
|---|---|---|
| Mineola Plumbing | Plumbing Services | Plumbers often spot failing heating and cooling systems while working in basements, and we regularly encounter plumbing issues during HVAC installs that we can send their way. |
Contracts and payment terms
The business benefits from auto-renewing contracts, which contribute to its recurring revenue stream. This provides a stable foundation for financial planning.
Operating manual grade
SOP documentation level: Core processes documented.
- SOP documentation level
- Core processes documented
- SOP storage location
- A shared drive, loosely organized
- Role definitions
- Partially
- SOPs documented
- No
- SOPs stored centrally
- No
- Roles written
- No
Management systems
Operating rhythm: Both a huddle and a monthly review.
- Written goals
- Some do
- Weekly performance verification
- Weekly scorecard with a metric per person
- One on one cadence
- Weekly
- Operating rhythm
- Both a huddle and a monthly review
- Written goals in place
- No
- Weekly verification in place
- Yes
- 1:1 cadence in place
- Yes
- Operating rhythm in place
- Yes
Owner dependence
- Owner-only tasks
- Minor hit
- Key person risk flagged
- No
- Cost to replace the owner with a manager (annual)
- $95,000
Succession and transition status
- Exit timing
- 3~5 years
Supplier concentration
- Largest supplier share of spend
- Under 25%
- Backup supplier qualified
- Yes
Capacity
- Off peak labour hours
- 35.5
Conveying assets
- Conveying assets documented
- No
Operational KPIs
- Financial grade
- A
- Lender grade
- A
- Credit tier
- tier 2
Industry frame
The business operates in the hvac industry.
- Industry
- hvac
- Benchmark source
- src/core/industry-data/catalog.ts#hvac@v1
Named competitors
Pricing was checked for 3 of them.
| Competitor | Published price | How this business wins |
|---|---|---|
| Maple Air Heating and Cooling | $189 | |
| Aire One Peel Heating & Cooling | $164 | |
| MH Heating and Cooling Solutions | $2,499 | |
| Peel Comfort Air | Maple Crest already runs a flat-rate price menu and reviewers confirm the invoice matches the quote. | |
| Streetsville Heating Co | Maple Crest already runs a flat-rate price menu and reviewers confirm the invoice matches the quote. | |
| AirLoyal Mechanical | Maple Crest already runs a flat-rate price menu and reviewers confirm the invoice matches the quote. | |
| QuickTemp HVAC | Maple Crest already runs a flat-rate price menu and reviewers confirm the invoice matches the quote. |
Pricing position
| Competitor | Published price |
|---|---|
| Maple Air Heating and Cooling | $189 |
| Aire One Peel Heating & Cooling | $164 |
| MH Heating and Cooling Solutions | $2,499 |
Moat and whitespace
The competitive moat pillar scores 75 out of 100.
| Gap | Competitor weakness | How this business fits |
|---|---|---|
| Published flat-rate pricing | Three of four competitors publish no prices at all, and reviewers call out surprise fees and quote delays. | Maple Crest already runs a flat-rate price menu and reviewers confirm the invoice matches the quote. |
| Maintenance membership ownership | No competitor promotes an annual maintenance plan; Streetsville tells customers to just call each year. | Comfort Club membership with 310 active billing relationships and seasonal reminder calls. |
| Emergency and weekend coverage | Reviewers report multi-day waits for dead furnaces and no weekend slots at two competitors. | Same-week emergency capacity, with priority routing for plan members. |
Historical P&L
The most recent period on file (FY2025) reports revenue of $7,400,000.
| Period | Revenue | Cost of goods sold | Operating expenses | EBITDA | Depreciation and amortization | Interest expense | Tax expense | Revenue growth |
|---|---|---|---|---|---|---|---|---|
| FY2023 | $6,450,000 | $3,676,500 | $1,548,000 | $1,225,500 | $154,800 | $36,000 | $141,000 | 7.1% |
| FY2024 | $6,950,000 | $3,892,000 | $1,640,200 | $1,417,800 | $166,800 | $31,000 | $162,000 | 7.8% |
| FY2025 | $7,400,000 | $4,070,000 | $1,714,315 | $1,615,685 | $177,600 | $25,900 | $183,584 | 6.5% |
Track record
Revenue grew 7.1% a year from FY2023 to FY2025. Sales rose in every year on file. Three consecutive statement-backed years are on file.
- Direction
- Up
- Sales up every year
- Yes
- Sales growth swing, high to low
- 1.3 points
- Three statement-backed years on file
- Yes
| Year | Revenue | EBITDA | EBITDA margin | Revenue growth | Source |
|---|---|---|---|---|---|
| FY2023 | $6,450,000 | $1,225,500 | 19.0% | Sample | |
| FY2024 | $6,950,000 | $1,417,800 | 20.4% | 7.8% | Sample |
| FY2025 | $7,400,000 | $1,615,685 | 21.8% | 6.5% | Sample |
| Year | Debt service coverage | Meets the lender target |
|---|---|---|
| FY2025 | 12.13x | Yes |
| FY2024 | 10.20x | Yes |
| FY2023 | 8.45x | Yes |
Forecast
Drawn from 3 years on file, growing 7.1% a year, starting from FY2025. Growth is slowed each year as the business gets bigger, and the profit margin and the multiple are held where they are today. The pace is also held near what this industry itself is growing at.
- Projected from
- FY2025
- EBITDA margin held across the projection
- 21.8%
- FY2026 EBITDA
- $1,729,864
- FY2026 worth, plus or minus 12%
- $6,771,359
- FY2028 EBITDA
- $1,981,710
- FY2028 worth, plus or minus 20%
- $7,757,182
- FY2030 EBITDA
- $2,269,349
- FY2030 worth, plus or minus 28%
- $8,883,117
| Year | Revenue | EBITDA | Worth | Worth, low | Worth, high | Growth applied |
|---|---|---|---|---|---|---|
| FY2025 (actual) | $7,400,000 | $1,615,685 | $6,324,420 | |||
| FY2026 | $7,922,950 | $1,729,864 | $6,771,359 | $5,958,796 | $7,583,922 | 7.1% |
| FY2028 | $9,076,429 | $1,981,710 | $7,757,182 | $6,205,746 | $9,308,619 | 7.0% |
| FY2030 | $10,393,849 | $2,269,349 | $8,883,117 | $6,395,844 | $11,370,389 | 7.0% |
Margin and OpEx
EBITDA margin in the most recent period on file is 21.8%.
- EBITDA margin, FY2025
- 21.8%
| Period | Gross margin | EBITDA margin | Operating expenses as a percent of revenue |
|---|---|---|---|
| FY2023 | 43.0% | 19.0% | 24.0% |
| FY2024 | 44.0% | 20.4% | 23.6% |
| FY2025 | 45.0% | 21.8% | 23.2% |
Add-backs and normalized earnings
- Owner market rate reference
- $95,000
- Personal expense add-backs
- $18,000
- How owner pay was treated
- Only the amount of owner compensation above a market wage was added back.
- Add-back disclosure (Q31)
- 140000
- Add-back disclosure (Q32)
- 18000
| Description | Type | Cadence | Annual amount |
|---|---|---|---|
| What the owner pays themselves | Owner compensation | Annual | $140,000 |
| Personal expenses run through the business | Personal expense | Annual | $18,000 |
| Market rate for a replacement manager | Owner market rate reference | Annual | $95,000 |
| Description | Amount |
|---|---|
| $45,000 | |
| $18,000 |
Balance sheet
Balance sheet on file as of FY2025.
| Period | Cash | Accounts receivable | Inventory | Current assets | Total assets | Accounts payable | Current liabilities | Total liabilities | Shareholders equity |
|---|---|---|---|---|---|---|---|---|---|
| FY2023 | $471,000 | $520,000 | $131,000 | $1,262,000 | $2,300,000 | $305,000 | $590,000 | $1,150,000 | $1,150,000 |
| FY2024 | $548,000 | $556,000 | $139,000 | $1,386,000 | $2,470,000 | $320,000 | $610,000 | $1,110,000 | $1,360,000 |
| FY2025 | $629,000 | $592,000 | $148,000 | $1,517,000 | $2,654,750 | $333,000 | $632,700 | $1,075,590 | $1,579,160 |
Working capital
- When customers pay
- At delivery
Debt and guarantees
- Personal guarantee release
- Some
Earnings credibility
- Owner confirmation of the figures
- Owner attested the figures; bank statements not available
- Factors affecting earnings credibility
- record_keeping; reconciliation_not_checked; comp_confidence_low
- Bookkeeping practice (Q13)
- Accountant-reviewed
Unit economics
- Period
- FY2025
- Net income
- $1,406,201
- Financial grade
- A
- Lender grade
- A
- Cash flow grade
- B
- Labour grade
- A
- Credit tier
- Tier 2
Valuation range and multiple build
The business's estimated worth centers around $6,324,420, based on its most recent completed valuation.
- Final valuation multiple
- 3.52x
- Normalized earnings
- $1,678,685
- Market approach value
- $5,908,971
- Income approach value
- $9,274,503
- Asset floor value
- $1,200,000
- Currency
- CAD
- Valuation as of
- 2026-10-10
Driver scorecard
9 of 9 value drivers have a scored assessment on file.
- Value drivers with a scored assessment
- 9
| Value driver | Score | Industry median |
|---|---|---|
| Financial Performance | 78 | 50 |
| Owner Dependence | 74 | 35 |
| Recurring Revenue | 62 | 45 |
| Single Points of Failure | 75 | 60 |
| Transferability | 57 | 45 |
| Competitive Moat | 75 | 45 |
| Growth Potential | 70 | 55 |
| Cash-flow Strength | 80 | 45 |
| Customer Satisfaction | 74 | 50 |
Lender readiness
The business carries an institutional credit grade of AAA (prime).
- Institutional credit grade
- AAA
- Grade status
- PRIME
- Financial grade
- A
- SBA financing tier
- EXCEPTIONAL
- Institutional note
- Exceptional. Banks will compete for this ~ expect their best rates and terms.
- Financial period used
- FY2025
- Annual debt service used
- $133,200
- Down payment assumed
- 20.0%
| Metric | Value | Lender target | Variance to target | Status |
|---|---|---|---|---|
| DSCR (debt coverage) | 13.463 | 1.25 | 977.0% | strong |
| FCCR (fixed charges) | 10.87 | 1.2 | 805.8% | strong |
| Debt-to-equity | 0.681 | 3 | -77.3% | strong |
| Liquidity (burn-adj) | 2.398 | 1.5 | 59.8% | strong |
| EBITDA margin | 24.234 | 15 | 61.6% | strong |
| LTV coverage | 0.8 | 0.8 | 0.0% | strong |
Financing at the ask
At an ask of $6,324,420 against normalized earnings of $1,678,685, this section shows what a lender will weigh.
- Ask as a multiple of normalized earnings
- 3.77x
- SBA financing tier
- EXCEPTIONAL
- SBA approval likelihood
- 96.0%
- Institutional credit grade
- AAA
Risk profile
- Overall risk resilience score
- 73.65 out of 100
| Indicator | Area | Exposure | Basis |
|---|---|---|---|
| Packaging Mandate | Supply chain | Low (15 out of 100) | Baseline shock exposure 15%. |
| Permit/License Fees | Fixed cost | Low (15 out of 100) | Baseline shock exposure 15%. |
| Payroll Tax Spike | Labor | Low (20 out of 100) | Baseline shock exposure 20%. |
| Scheduling Complexity | Labor | Low (20 out of 100) | Baseline shock exposure 20%. |
| Inventory Shrinkage | Supply chain | Low (20 out of 100) | Baseline shock exposure 20%. |
| Technology Fee Spike | Agreement friction | Low (20 out of 100) | Baseline shock exposure 20%. |
| Marketing Fund Mandate | Agreement friction | Low (20 out of 100) | Baseline shock exposure 20%. |
| Training Requirements | Agreement friction | Low (20 out of 100) | Baseline shock exposure 20%. |
| Utility Cost Surge | Fixed cost | Low (20 out of 100) | Baseline shock exposure 20%. |
| Benefits Mandate | Labor | Low (25 out of 100) | Baseline shock exposure 25%. |
| Supplier Consolidation | Supply chain | Low (25 out of 100) | Baseline shock exposure 25%. |
| Fuel Surcharge | Supply chain | Low (25 out of 100) | Baseline shock exposure 25%. |
| Currency Shock | Supply chain | Low (25 out of 100) | Baseline shock exposure 25%. |
| Quality Control Failure | Supply chain | Low (25 out of 100) | Baseline shock exposure 25%. |
| Supply Chain Disruption | Supply chain | Low (25 out of 100) | Baseline shock exposure 25%. |
| Royalty Ratchet | Agreement friction | Low (25 out of 100) | Baseline shock exposure 25%. |
| Compliance Costs | Agreement friction | Low (25 out of 100) | Baseline shock exposure 25%. |
| Lease Renewal Shock | Fixed cost | Low (25 out of 100) | Baseline shock exposure 25%. |
| Insurance Premium Spike | Fixed cost | Low (25 out of 100) | Baseline shock exposure 25%. |
| Equipment Failure | Fixed cost | Low (25 out of 100) | Baseline shock exposure 25%. |
| The Ghosting Effect | Labor | Low (30 out of 100) | Baseline shock exposure 30%. |
| The Overtime Trap | Labor | Low (30 out of 100) | Baseline shock exposure 30%. |
| Turnover Tsunami | Labor | Low (30 out of 100) | Baseline shock exposure 30%. |
| Territory Encroachment | Agreement friction | Low (30 out of 100) | Baseline shock exposure 30%. |
| The Triple Net Trap | Fixed cost | Low (30 out of 100) | Baseline shock exposure 30%. |
| Interest Rate Shock | Fixed cost | Low (30 out of 100) | Baseline shock exposure 30%. |
| The Wage Floor | Labor | Low (35 out of 100) | Baseline shock exposure 35%. |
| The 15% Commodity Spike | Supply chain | Low (35 out of 100) | Baseline shock exposure 35%. |
| The Agreement Friction | Agreement friction | Low (35 out of 100) | Baseline shock exposure 35%. |
Resilience and buffers
Its strongest buffer is labor cost headroom at 200.0% of headroom.
| Component | Score |
|---|---|
| Staffing costs | 97 out of 100 |
| Supplies and inventory | 91 out of 100 |
| Agreement and fee terms | 94 out of 100 |
| Fixed bills (rent, loans) | 99 out of 100 |
| Buffer | Headroom |
|---|---|
| EBITDA buffer | 21.8% |
| Net income buffer | 19.0% |
| Labor cost headroom | 200.0% |
| Cost of goods sold headroom | 34.6% |
| Royalty headroom | 19.0% |
| Rent headroom | 200.0% |
Growth levers
Market research also shows 3 gaps competitors are leaving unserved. 1 referral partner has been shortlisted.
| Opportunity | Category | Horizon | Effort | Projected annual profit impact |
|---|---|---|---|---|
| Document standard operating procedures | Labor operations | This month | Medium | |
| Implement monthly sales forecasting | Financial | This month | Medium | |
| Renegotiate vendor and supply costs | Financial | This month | Medium | $203,500 |
| Introduce Good / Better / Best tiered pricing | Pricing | This month | Medium | $283,050 |
| Build an emergency cash reserve | Financial | This month | Low | |
| Conduct a line-by-line expense audit | Financial | This week | Low | $128,574 |
| Stand up a referral program | Revenue | This week | Low | $183,150 |
| Add a post-service follow-up sequence | Retention | This week | Low | $116,550 |
| Extend payables to standard net terms | Cashflow | This month | Low | $2,590 |
| Collect payment same-day on completion | Cashflow | This week | Low | $4,533 |
| Establish a consistent social content cadence | Online presence | This month | Medium | $83,250 |
| Install a speed-to-lead system | Sales | This month | Medium | $233,100 |
| Gap | Why it is open | Why this business can take it |
|---|---|---|
| Published flat-rate pricing | Three of four competitors publish no prices at all, and reviewers call out surprise fees and quote delays. | Maple Crest already runs a flat-rate price menu and reviewers confirm the invoice matches the quote. |
| Maintenance membership ownership | No competitor promotes an annual maintenance plan; Streetsville tells customers to just call each year. | Comfort Club membership with 310 active billing relationships and seasonal reminder calls. |
| Emergency and weekend coverage | Reviewers report multi-day waits for dead furnaces and no weekend slots at two competitors. | Same-week emergency capacity, with priority routing for plan members. |
| Partner | Category | Why it fits |
|---|---|---|
| Mineola Plumbing | Plumbing Services | Plumbers often spot failing heating and cooling systems while working in basements, and we regularly encounter plumbing issues during HVAC installs that we can send their way. |
| Play | Channel | Expected effect | Effort | Cost |
|---|---|---|---|---|
| Launch a targeted winter furnace tune-up direct mail campaign | Direct Mail | Predictable upfront cash flow and filled schedules during shoulder seasons in Mississauga | Medium | Medium |
| Rebuild your local digital marketing engine | Paid media and local SEO | Steady stream of emergency repair and replacement calls throughout Mississauga instead of relying solely on seasonal weather swings | High | High |
| Set up a structured double-sided referral program | Email and direct outreach | More high-margin furnace and AC repair jobs through trusted word-of-mouth without paying expensive ad rates | Low | Free |
| Deploy a win-back email sequence for past customers | Email Marketing | Immediate service bookings and quick revenue from homeowners who already know and trust your multi-location team in Mississauga | Low | Free |
Reason for sale
The owner's stated goal for the sale: growth first, with a sale open on the right terms.
- Primary goal for the sale
- growth first, with a sale open on the right terms
- Planned exit timing
- a planned transition over three to five years
- Deal kind sought
- HVAC service & tune-ups
- Owner tenure
- 10+ years
- Cost per year to replace the owner with a manager
- $95,000
Transaction overview
The seller's primary goal for this sale: growth first, with a sale open on the right terms.
- What conveys in a sale
- Equipment / tangible assets, Client list, Contracts, Brand, Team
- Planned exit timing
- a planned transition over three to five years
- Primary goal for the sale
- growth first, with a sale open on the right terms
Data room index
| Document type | Status | Filename |
|---|---|---|
| extracted | PETCARE_TEST_Excellent_2.pdf | |
| extracted | PETCARE_TEST_Excellent.pdf | |
| extracted | TEST_Financials_Petcare_Good.pdf |
Industry benchmarks detail
- Benchmark industry
- hvac
- Benchmark region
- default
- Benchmark source
- src/core/industry-data/catalog.ts#hvac@v1
- Unit economics period
- FY2025
- Credit tier
- Tier 2
- Financial grade
- A
- Lender grade
- A
- Cash flow grade
- B
- Labour grade
- A
Glossary
| Term | Definition |
|---|---|
| cim | A confidential information memorandum ~ the sale package a buyer reads before making an offer. |
| comp set | A set of comparable businesses used to judge what this one might sell for. |
| data room | The folder of documents a buyer reviews during due diligence. |
| ebitda | Earnings before interest, taxes, depreciation and amortization ~ a common measure of operating profit. |
| sde | Seller's discretionary earnings ~ profit plus owner-only costs a buyer adds back, such as the owner's salary and personal expenses run through the business. |
| SOP | SOP stands for standard operating procedure ~ a simple written guide that lays out the steps for a task so anyone on your team can do it the same way every time, even when you're not there. |
Next steps and contact
- Prepared by
- Michael Mallette, Principal
- Firm
- Lift & Exit Advisory
- Phone
- (555) 014 2200
- advisor@liftandexit.com
- Website
- https://liftandexit.com
How the process works
- 1Indication of interest. You tell Lift & Exit Advisory in writing what you would pay, how you would fund it and the timetable you want. Nothing is binding at this stage.
- 2Letter of intent. The buyer and the owner sign a letter that sets the price, the structure of the deal and a period of exclusivity.
- 3Data room and full due diligence. You get access to the full records and the time to verify everything in this memorandum before closing.
Lift & Exit Advisory manages the process throughout and sets the timetable for each stage.
Important notice
The information in this memorandum was believed to be accurate on the date it was prepared. It came from the owner of the business and from public sources, and it has not been independently audited.
Businesses and their markets change every day, so the figures here will move. No representation or warranty, express or implied, is given as to the accuracy or completeness of anything in this memorandum, and neither Lift & Exit Advisory nor the owner accepts liability for a decision taken in reliance on it.
A buyer must carry out its own due diligence and take its own legal, tax and accounting advice. Only the statements written into a signed purchase agreement will bind the owner.
This memorandum is a summary. It is not an offer to sell and it is not a solicitation of an offer to buy. The confidentiality terms and the non-disclosure agreement you accepted before opening it continue to apply to every copy of it and to every note taken from it.
Project Maple is an example. The business, the figures, the advisory firm and the contact details above are invented for this sample ~ nothing here is a live listing, and nothing in the document links anywhere.
Build one for a real client today.
$299/month per advisor ~ 2 clients and 10 lead claims included, $99/month per extra client ~ cancel anytime